DATA VISUALIZATION
Embroidered Viz:
A 90-Day Snapshot of Communication
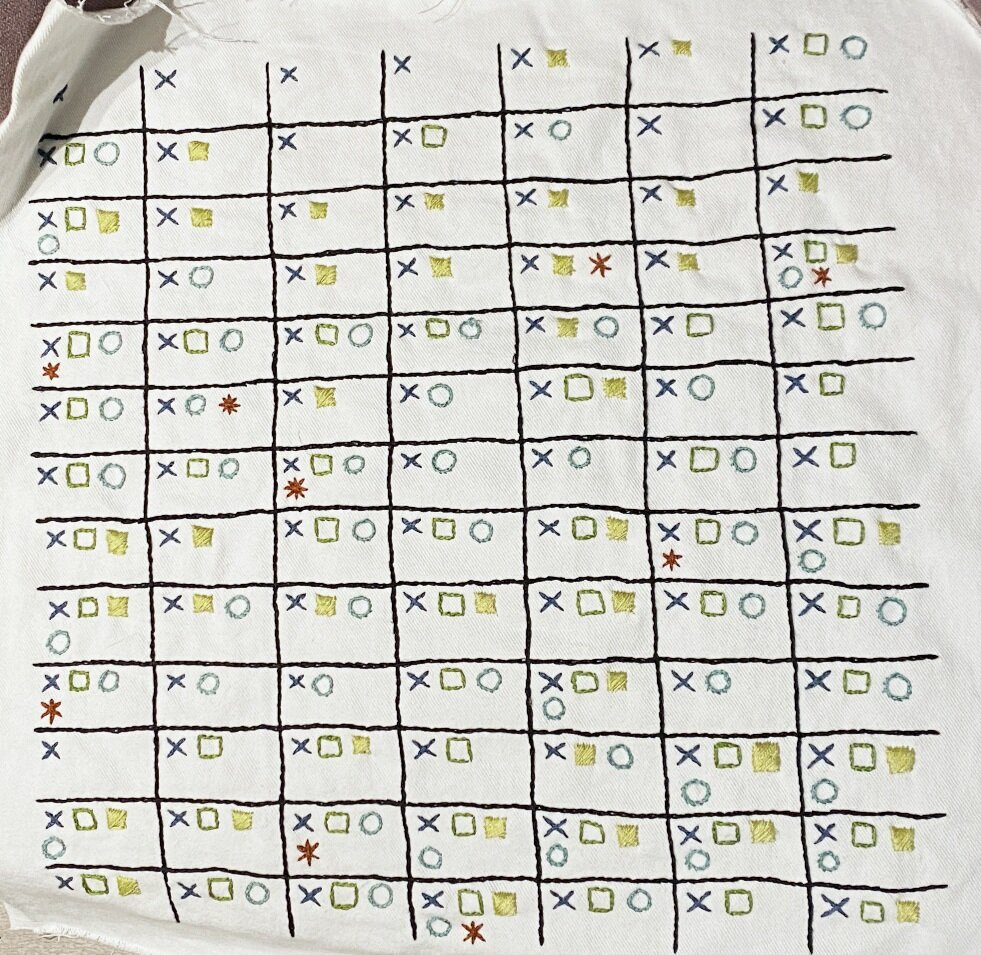
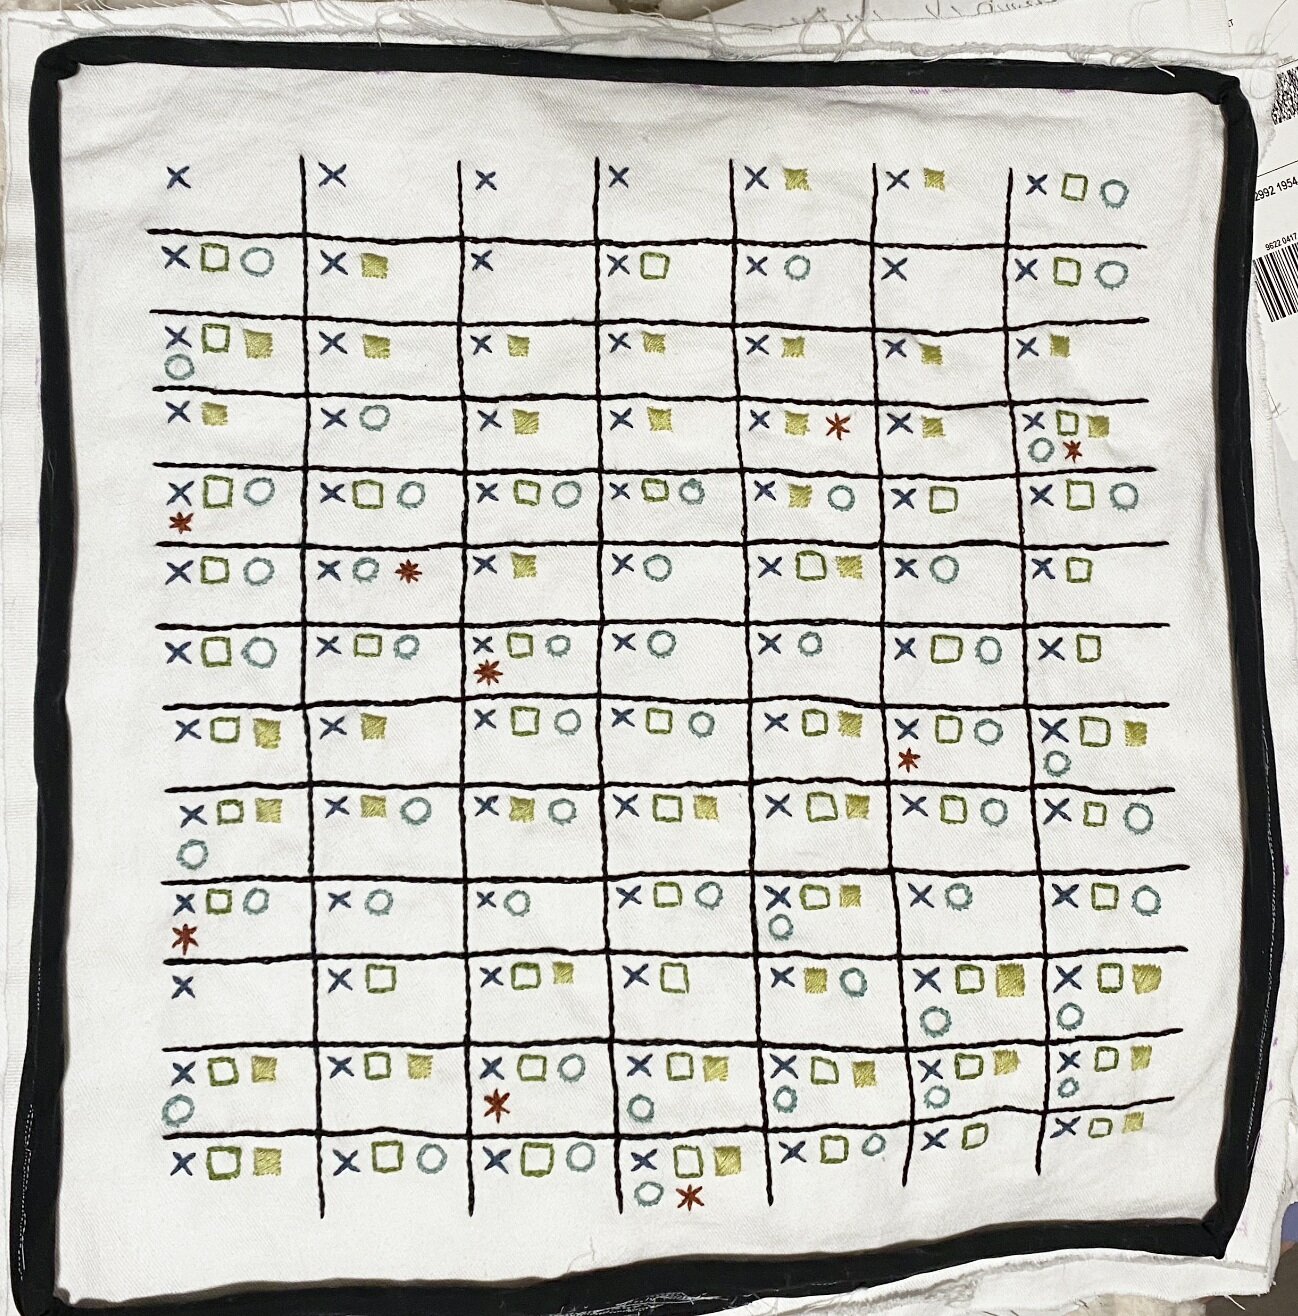
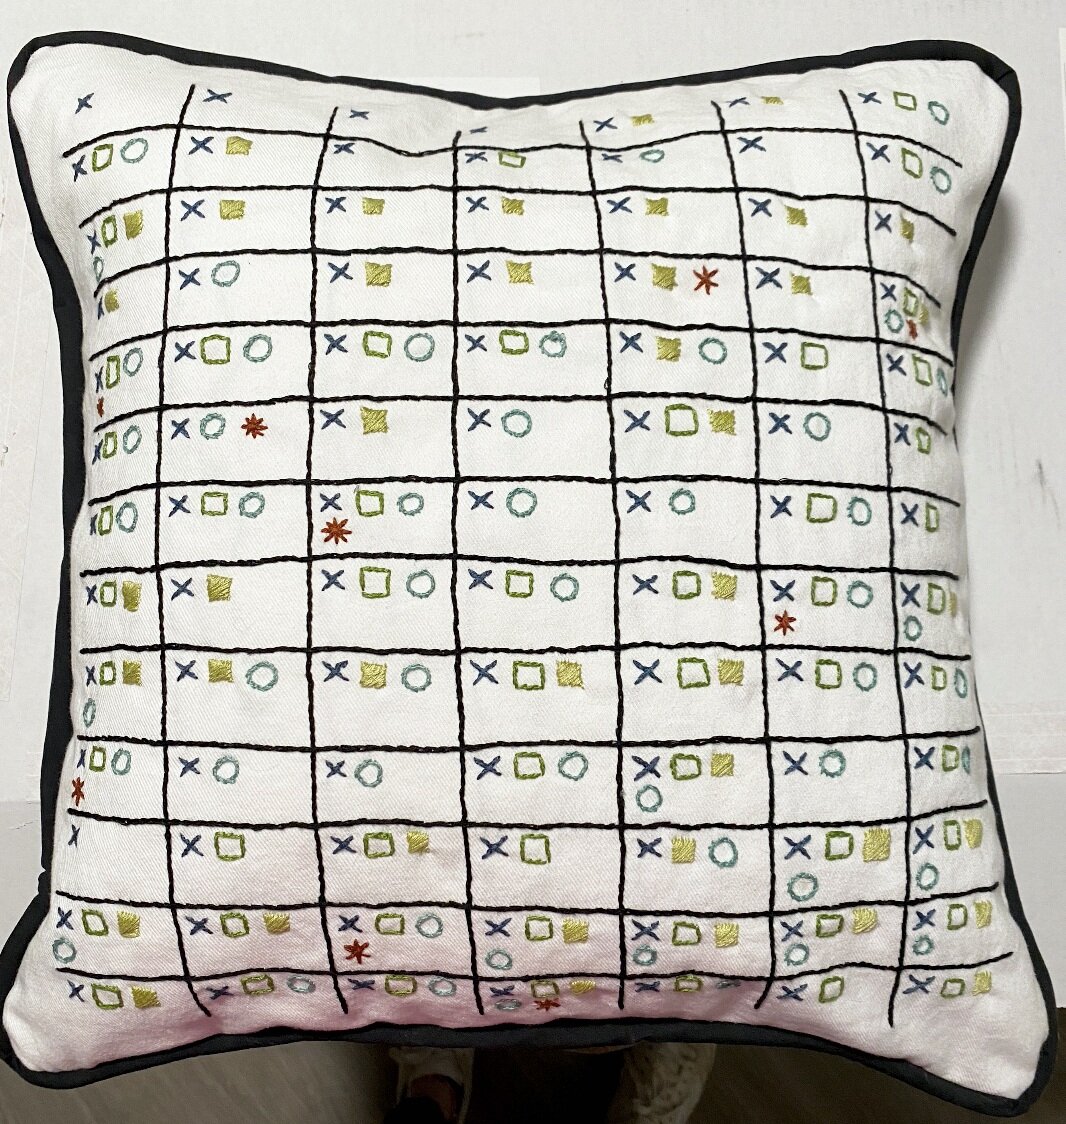
Why not combine data, design, sewing, and embroidery? Creating an embroidered viz has been on my list for awhile, so I decided to create a personal project that shows a snapshot of 90(ish) days of communication between me and my partner. I came up with symbols for five different communication types, and then recorded Y/N each day for if that type of communication occurred. Then, I created a “calendar” of sorts to display them on — a 7-cell-wide grid (one week) – embroidered each instance, and sewed it into a pillow. The result: an abstract pillow with more meaning in it than first appears.
Created as personal project, 2021
I love giving homemade gifts, and I love getting creative with data
My process: a labor of love
The idea
I first had the idea of wanting to create some kind of unique visualization as a gift for my boyfriend, and I knew I wanted it to show our communication. I didn’t want to just give a graph – for obvious reasons. I thought about creating a poster, but you can’t really use that, and I wanted it to be more tactile. So I thought, why not embroider it? And then that’s where the whole sew-it-into-a-pillow idea came in.
The data
I gathered and recorded data on the following forms of communication: text, phone call, FaceTime, in-person, and notes. (Thanks Verizon for easy access to some of that data). My spreadsheet was now ready to be turned into a calendar. Instead of showing magnitude of each type of communication, I wanted the focus to be on the types of communication and how often during the week we did each. So, I decided to go with a simple “yes” or “no” for each type in each day block.
I then decided on symbols and colors. I wanted the colors to be earth tones that would balance each other and match my boyfriend’s apartment. I spent too long standing in the embroidery isle comparing shades of green. I’m very particular about greens.
The set-up
First, I created my grid system. Originally I thought about doing columns 10 across, and I played with other variations since this had implications on the size of the cells. But a seven-row-across grid system ended up being the best choice, since this data was about how we communicated over time. Therefore it should match a calendar structure. Using Procreate, I sketched out the whole visualization to use it as an easy reference while embroidering. I also sketched out how each of the pieces of fabric and piping would need to be cut, laid out, and sewn. I did not want to mess anything up after embroidering. After cutting the fabric for the front, I used fabric marker to draw the grid. I didn’t sketch each symbol because I wanted it the symbols to have a bit of personality and not be so perfect.
The embroidery
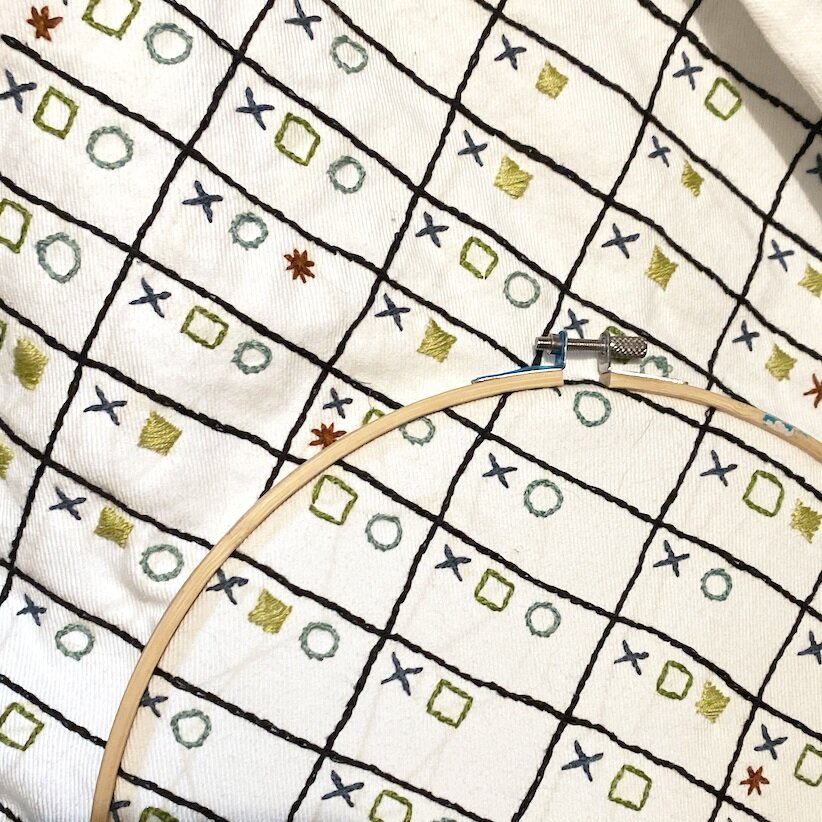
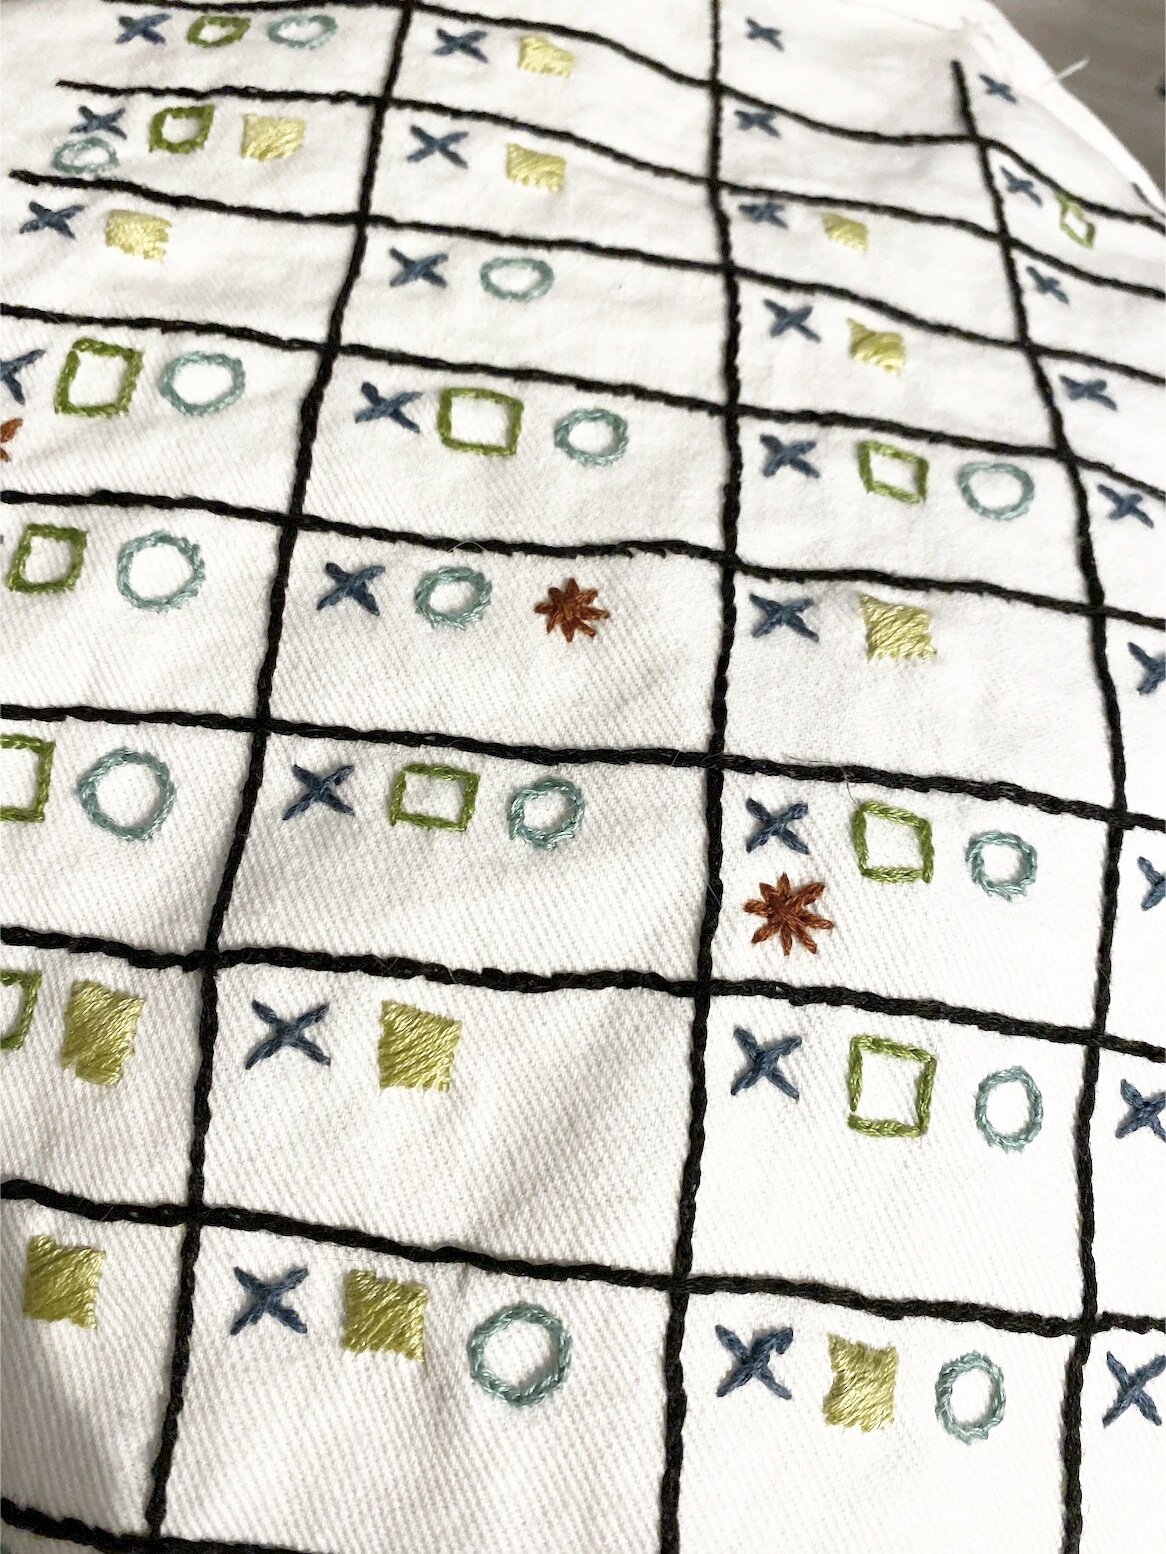
I knew the embroidery phase would take the longest, but I didn’t know just how long it would take. I spent several weeks full of late nights embroidering. I went through several skeins of colors, poked my fingers accidentally, and had to undo several symbols.
The sewing
I underestimated just how much of a toll the 18 years of sewing had taken on my little machine. It was struggling with the multiple layers of thick fabric, and struggling hard. Multiple needles were broken in the process, and I had to rethread the bobbin and machine too many times to count. But, my favorite part was finally turning it inside out to reveal the embroidery and completed pillow case, ready to be stuffed with the form. She was complete, and turned out exactly as (if not better than) I had imagined.


